Recommendation systems are prevailing in online ads. Let say youtube would feed ads to the user, based on users’ cookie and other online existence (such as google account, contact books act). The recommendation system is somehow smart, even able to guess your thinking.
Ifuture.ai serves for one of the biggest ads vendor on WeChat platform (Facebook’s Chinese equivalent). Ifuture.ai builds machine learning models to predict if a use would click the ads after a purchase, to improve the click-through rate (ctr). CTR is a hard-core index, while in north American, Adwords is widely used for CTR tracking.
The dataset is big ( billions entries of purchase history), including infos such as user id, gender, money spend, location, shop id, time of purchase, payment method, payment network, etc. Ad views and clicks records are smaller in size, with what ads be fed, and times of clicks and views by the user. To leverage this amount of data, of course big data skills should be leveraged.
These are the major components used in the project currently:
Cloud: Tencent cloud (like AWS EMR), including 1 master node and 4 work nodes, Hadoop hdfs pre-configured.
Pyspark: I love Pyspark because it is very natural for python user. Spark SQL could be anther option if you only want to explore the data for analysis.
Jupyterhub: Not all DS team use this but I strongly recommend this. With jupyterhub installed in the cloud, users could use jupiter notebook local, but running the task in the cloud.
Machine learning modules: Spark ML is handy and fast, using it’s unique pipeline system, which streams the indexing, standardize, feature vectoring, and spliting dataset etc. However, Spark ML is NOT as accurate as sklearn. What we could do alternatively is extract smaller dataset, and run Sklearn for modelling.
Through this lovely jupiter notebook gui what we can see what pyspark modules have been loaded: sparkcontext, spark.sql, spark.ml are loaded. Remember Pyspark is accommodated in Python 2 environment.
To load the data, we prefer Spark Dataframe instead of RDD, for Spark DataFrame keeps the schema, and as simple as Python Pandas or MySQL. Meanwhile, we could define the type such as ‘string’, ‘float’ etc. By comparison, using RDD to open the file (‘sc.textFile’) would only pass strings. In this project, we have 5 tables, including following table of 10+ features and purchase history (billion lines).
This is a huge file that should not be processed solely by one single computer. Hadoop plays key roles here, for files are distributed in Hadoop system. Let say we pass the following path to Spark. It is default by Hadoop Hdfs distributed. Alternatively, we can ETL small files (<100MB) locally, which has ‘file://’ prefix in the path. So don’t miss use these. In general, file size is the key.
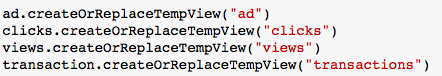
Because we have 5 raw data tables, including ads, clicks, views, purchase(transaction) etc. We create ‘TempView’ like what we did in MySQL ‘truncate’.
Those steps look quite long but quite standardized. Do not worry if you don’t understand it now. PySpark is not something like Excel loading a file or Python loading a data frame, because it is PySpark! ( And the DataBricks is my favourite company!)
2nd step is to explore the data. The data is so rich in information:

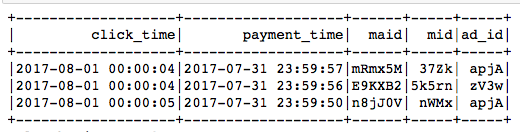
Each row represents one single transaction history. ‘maid’ is the WeChat user id, ‘mid’ is the shop id (physical shop). Some other info includes payment time, gender of user, payment (credit/debit), money spent, network (mobile, wifi etc), industry division, and locations of shop.
Based on this table, what we should be able to generate new features which might be insightful and helpful to understand the underline principles. The digging of new features we call it ‘feature engineering’, which is normally the most significant part of modelling.
Hence we could come up with certain new features:
User: how frequent the user purchase? How much the user spent averagely? Does he/she shop in one place or everywhere? Does he/she pay by credit a lot?
Shop: what is the gender ratio of the customer of this user? Do these shops encourage credit card use? how popular is this shop? Are those shops in the closed location have some similar patterns?
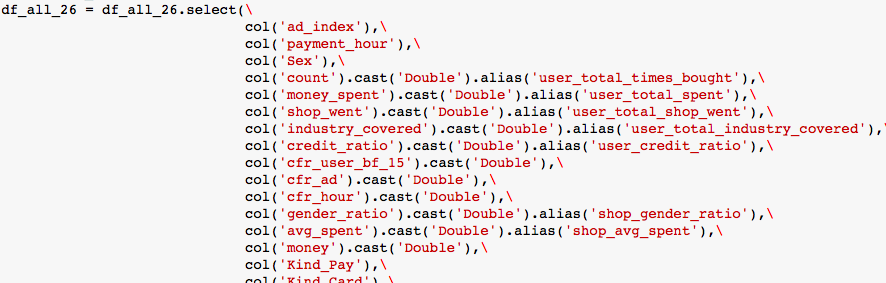
Hence we get much more features. I showed a feature I created. Can you guess what is it, by reading the script?
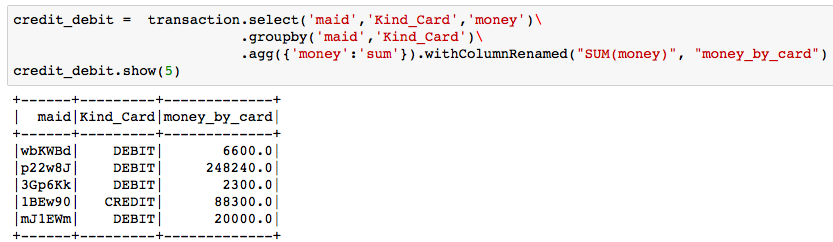

If you guess them right, it is ‘credit payment amount / all payment amount’, tells if the user is using credit card a lot. Feature engineering part is fun, and time consuming. According to experienced data scientists I know, they all agree feature engineering is the most important part in the lifecycle of modelling, instead of choosing and tuning the models!
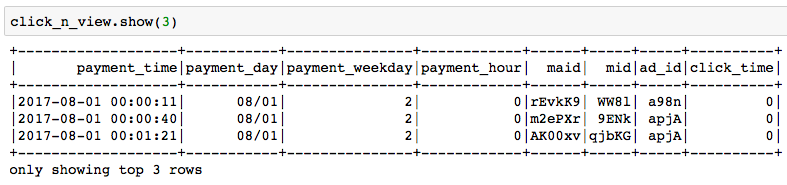
Now we look at the ‘click’ and ‘view’ tables. Info includes ‘maid’ , ‘mid’ again! Having these two columns, the features from previous table could be joined! Then pave the way to machine learning model.
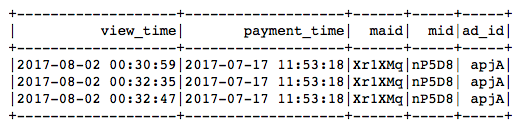
We look into the ‘click’ and ‘view’, we seem ‘time’ is the most richest info. Time tells you the days of week (Mon, Tues..), hours of day ( 1am, 2pm..), which is also significant. Based on different time columns, we could create new time features. Join the ‘click’ and ‘view’ together, and we symbol the ‘click after view’ as ‘1’, and vice vasa. We get the amazing table. Based on this, we can calculate the click-through-rate. I should omit here.
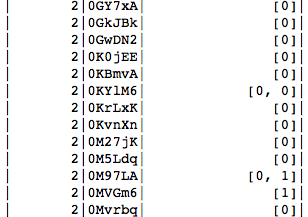
One fancy feature I created is the click history. Simply put, this feature would tell how the user responses to the some ads last two times he/she viewed it, on a given day. Using pyspark ‘collect_list’ and map by filtering would generate this lovely term. For instance, unitil 08/12, the user ‘0M97LA’ saw the same ad, initially he/she didn’t click, but he clicked in the following time. Most user didnt click. Put this column as categorical column would be very helpful to predict the user’s next behaviour.
One trick is we could leverage pandas/matplot to viz the data to see the distribution in PySpark for quick check up. Get notice the ‘toPandas()’ function. It is very often used by DS.

Once we build the models, we join all the tables, and save the final table in ‘parquet’ form. Actually we could save files in ‘csv’, ‘parquet’, or ‘.json’. But why ‘parquet’ is the best way?
It is related to the file structure. ‘csv’ is just strings after strings, separated by comma and ‘\n’. To load the ‘csv’, the whole data set should be load from front to end. ‘json’ is much better, it is similar to dictionary — it have well-defined structures. ‘parquet’ is similar to json, but it is read column by column. That’s why ‘parquet’ and ‘json’ so popular. Also, do remember to clearly define the type of input, mainly ‘double’, ‘float’, ‘int’, ‘string’.
For ‘int’ or ‘string’ type columns, most of them are ‘categorical columns’, which means they should not treated like ‘numerical columns’. ‘categorical columns’ are like ids, types, etc. Also remember to exclude ‘user_id’ , ‘shop_id’ when they are very large, to avoid crashing the computers ( warning would be ‘overhead limit’ )
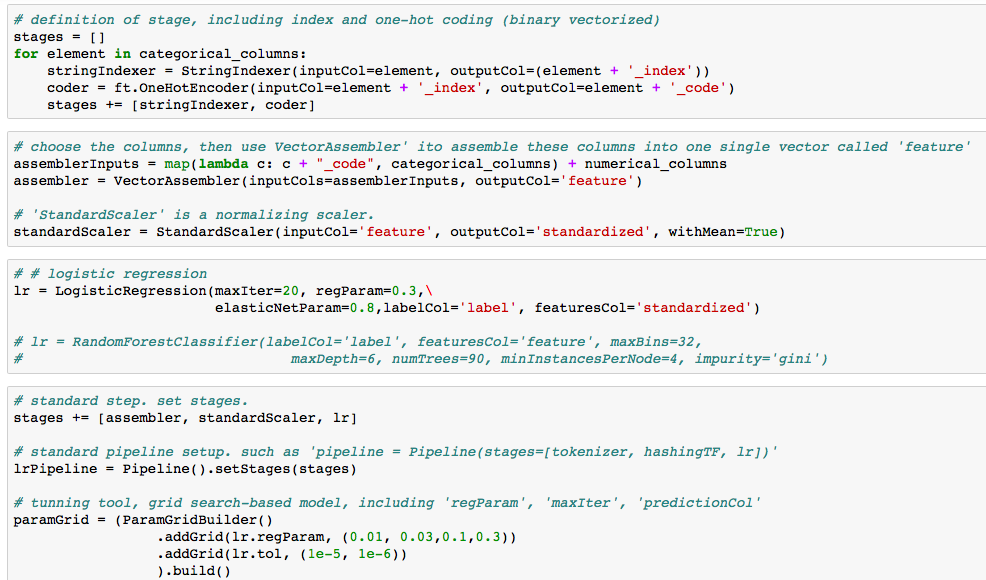
Then we treated the ‘categorical columns’ and ‘numerical columns’ differently. For ”categorical columns”, we should do ‘indexing’, ‘one-hot-encoding’, them ‘vectoring’ all columns to form one single large vector. Forming one single large vector is required by Spark ML. Spark ML is similar to Sklearn in python, but Spark ML has some more strict rules to conduct the machine learning. The ‘pipeline’ concept is really important in Spark ML, that’s why you would see something you never met outside of Spark. I added the comments in the following pic, so that you can understand what each comment doing here. Anyway, it is acutaully standard, after you used it several times.
The rest is the evaluation and validation. Can’t show you the result. But in general, big data is not hard right? Key is understanding the big data / hadoop and Spark ML environment so that we could fully utilize the most powerful tool – PySpark by Databricks!
modeling
Next time, I will show you how to automate Pyspark job by Airflow. It is an unprecedented combination of best data science and data engineering tools.

Cool, a lot of information, thanks for sharing!
LikeLike